Base dashboards
Point an Obsidian Base at a folder and ZettelFlow turns it into a dashboard — a local "Grafana for your vault". One Base is the datasource; you compose many panels over the same filtered result. The unit is the panel, not the chart: stat, bar, line, area, scatter, bubble, pie, donut, table, heatmap and a contribution-style calendar, all reading one shared, in-memory projection of your notes. No backend, nothing leaves Obsidian, and nothing is written back to your notes — a dashboard is read-only, with one deliberate exception: the checkbox of a task you tick in a Tasks panel.
It is distinct from the knowledge dashboard, which reports on the idea graph. Base dashboards chart the metadata of whatever notes a Base selects — daily working hours, mood, habits, reading, sleep — the things you used to chart with hand-written dataviewjs.
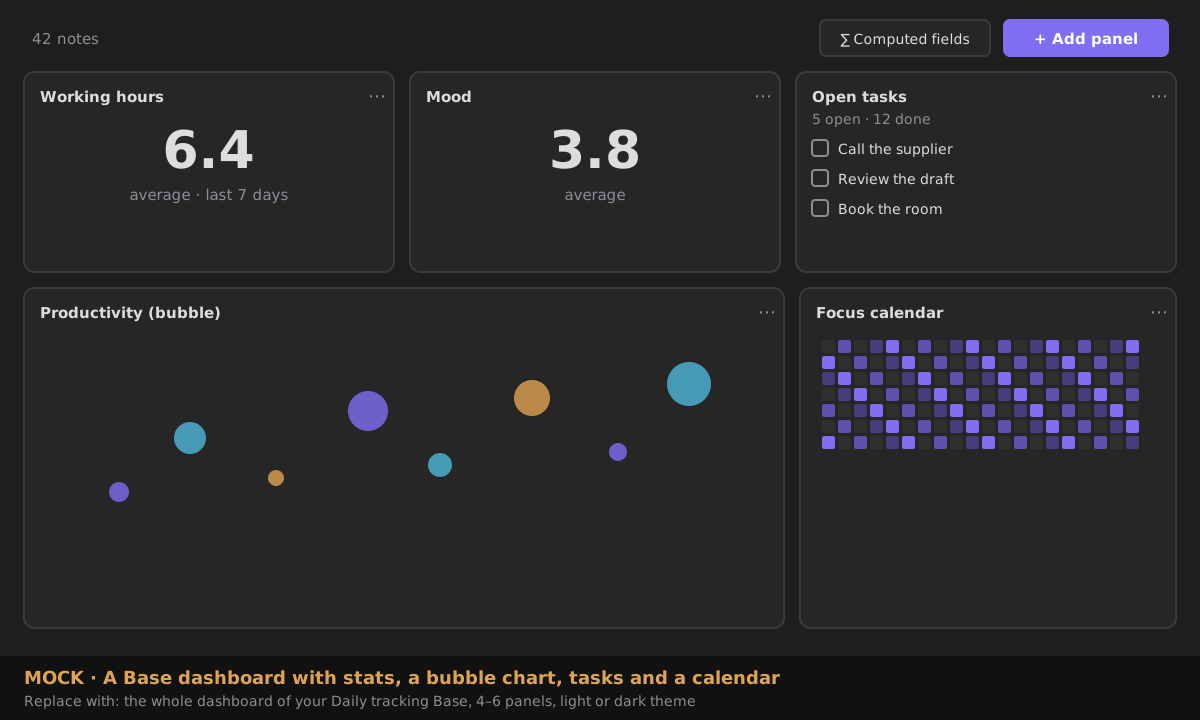
Open one
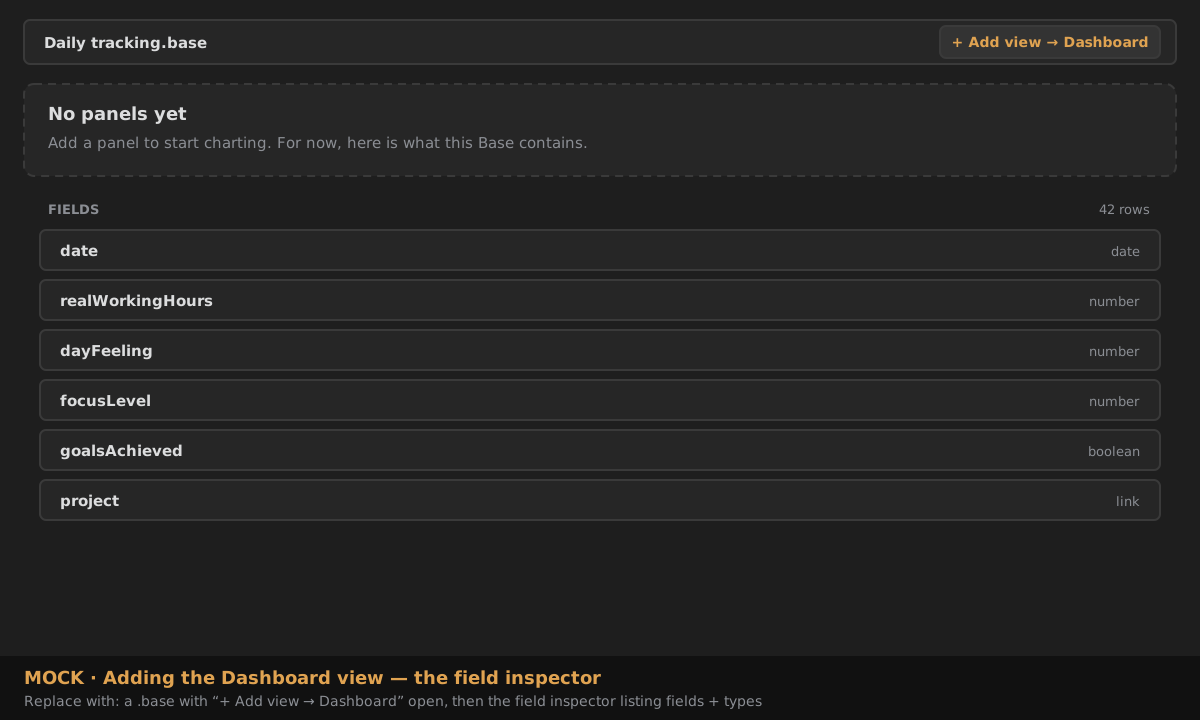
Open any .base, click + Add view, and choose Dashboard. With no panels yet, the view shows a field inspector: every property the Base exposes, the type ZettelFlow inferred for it (date, number, category, boolean, link) and the current row count. Edit the Base's filters and it reconciles live. Types come from Obsidian's own typed values — not guessed from raw text — so a date reads as a date and a link as a link.
Panels
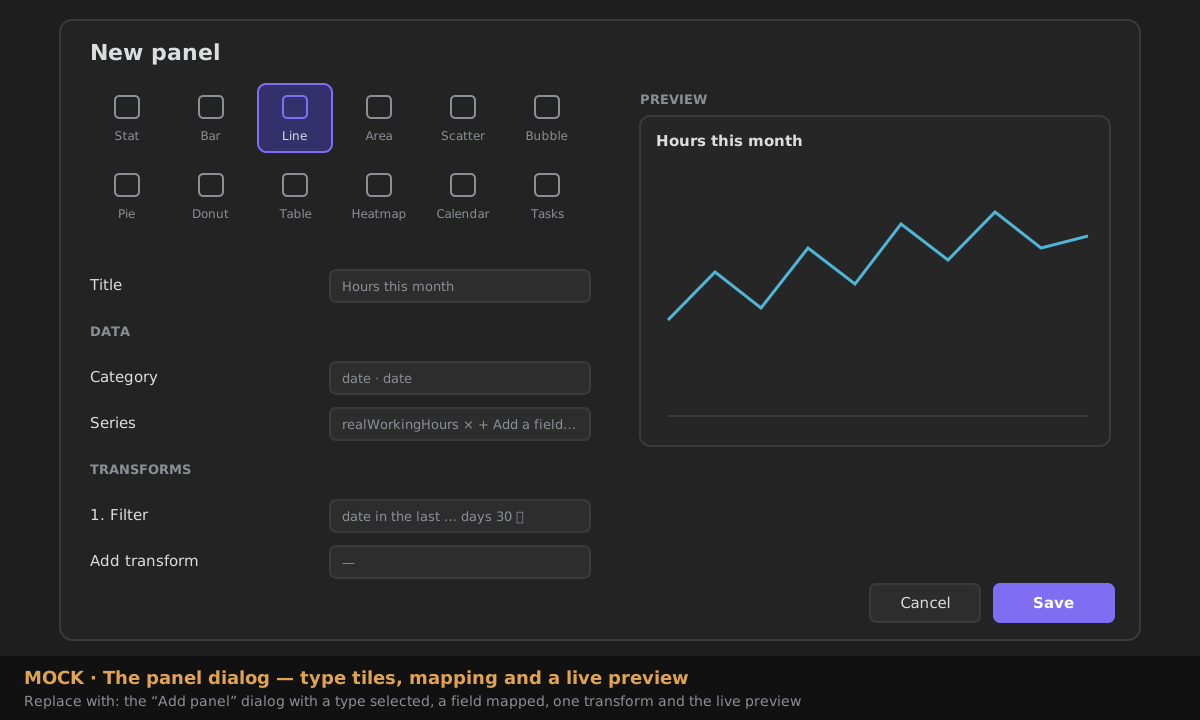
Add panel opens the panel dialog: pick a type from the icon tiles, map its fields (each picker shows the field's type, e.g. hours · number), and watch the live preview beside the form draw the panel with this Base's real data as you change it. ZettelFlow suggests a working mapping from the inferred schema, so it renders immediately and you adjust from there. Charts take their colours from your Obsidian theme and re-paint when you switch light/dark. Panels (and their layout) are saved in the Base's view config.
| Panel | What it draws |
|---|---|
| Stat | one number from a numeric field — sum, average, min, max, or a row count |
| Bar / Line / Area | a category or date on the x-axis, one or more numeric series |
| Scatter / Bubble | x vs y; a bubble adds size and colour from extra numeric fields |
| Pie / Donut | a share by category |
| Table | the mapped columns, sortable, rendered read-only |
| Heatmap | a category × category grid, coloured by a value |
| Calendar | a contribution-style day grid from a date field (+ optional value) |
| Tasks | the - [ ] tasks of the Base's notes — tick them off from the dashboard (below) |
A panel's card is quiet: its title and a ⋯ button. That button — or a right-click anywhere on the panel — opens Obsidian's own menu: Edit, Duplicate, Move left/right, the width (1, 2 or 3 columns), Tall, and Remove. Double-click the title to edit. Drag a panel by its header to reorder the grid — it lands before or after the panel you release over (on touch, use Move left/right from the menu).
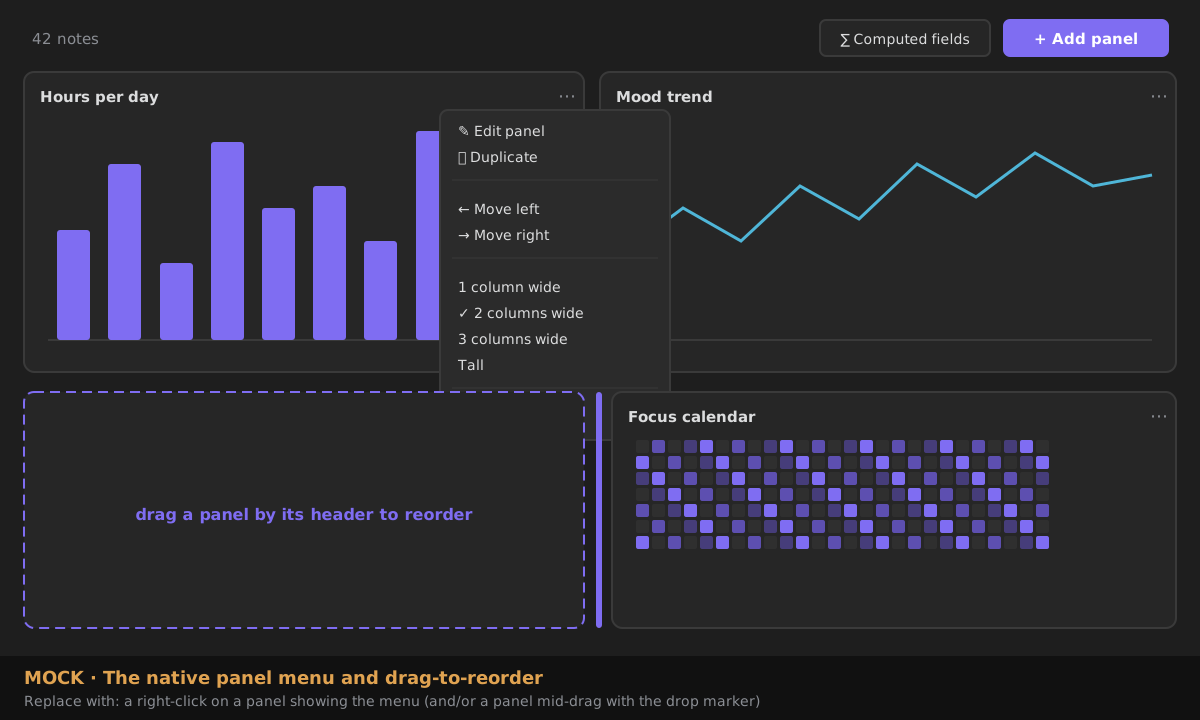 The grid reflows to a single column on a narrow pane or on mobile. (Treemap, radar and sankey are intentionally left for later.)
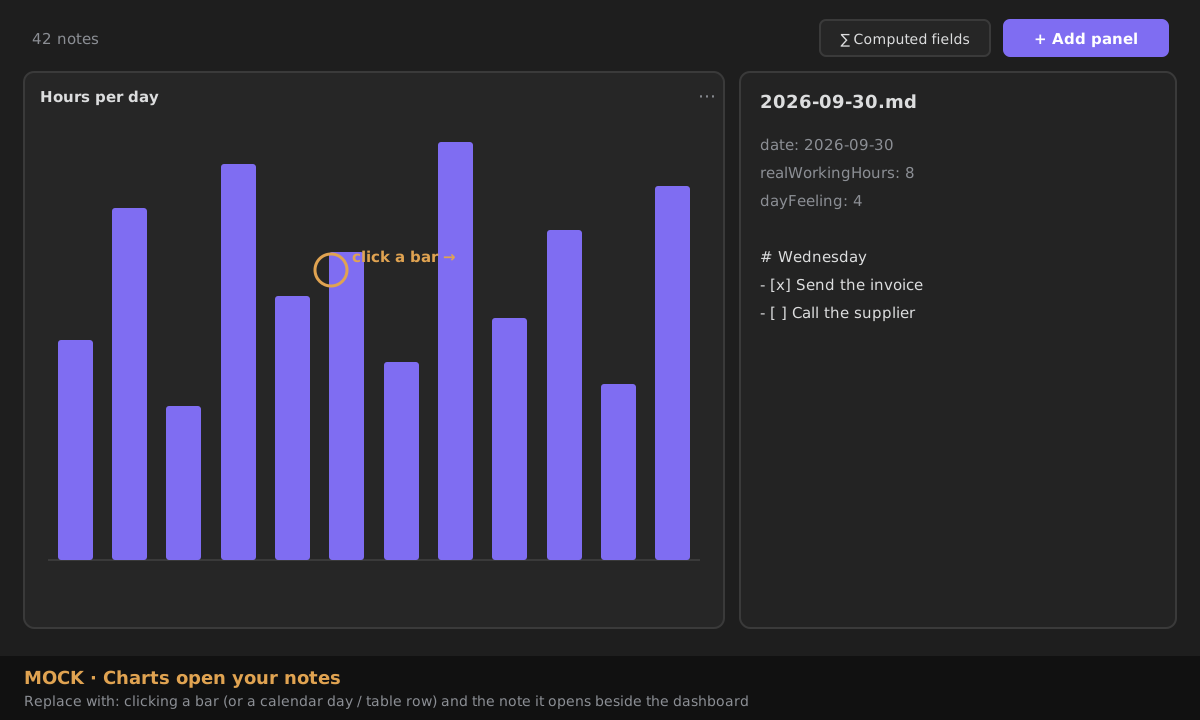
A chart is a way into your notes. Click a bar, a point, a slice, a table row or a calendar day to open the note behind it — Mod-click opens it in a new tab, as everywhere in Obsidian. A day that holds several notes offers a menu to pick one. Hover a table row (with Mod, per your Page preview settings) for a page preview. A row a transform aggregated has no single note, so it opens nothing.
Tasks
The Tasks panel lists the Markdown tasks (- [ ], * [ ], 1. [ ]) of the notes the Base selects, read from Obsidian's own index. There is no field to map, and no query language to learn: the Base already chose the notes. It shows N open · M done, then the tasks under each note's name, subtasks indented, in the order they appear. In the panel dialog choose Show (Open, Done or All) and whether to Group by note. Transforms apply to the notes first, so this week's open tasks is a Tasks panel with one Filter · date · in the last … days · 7.
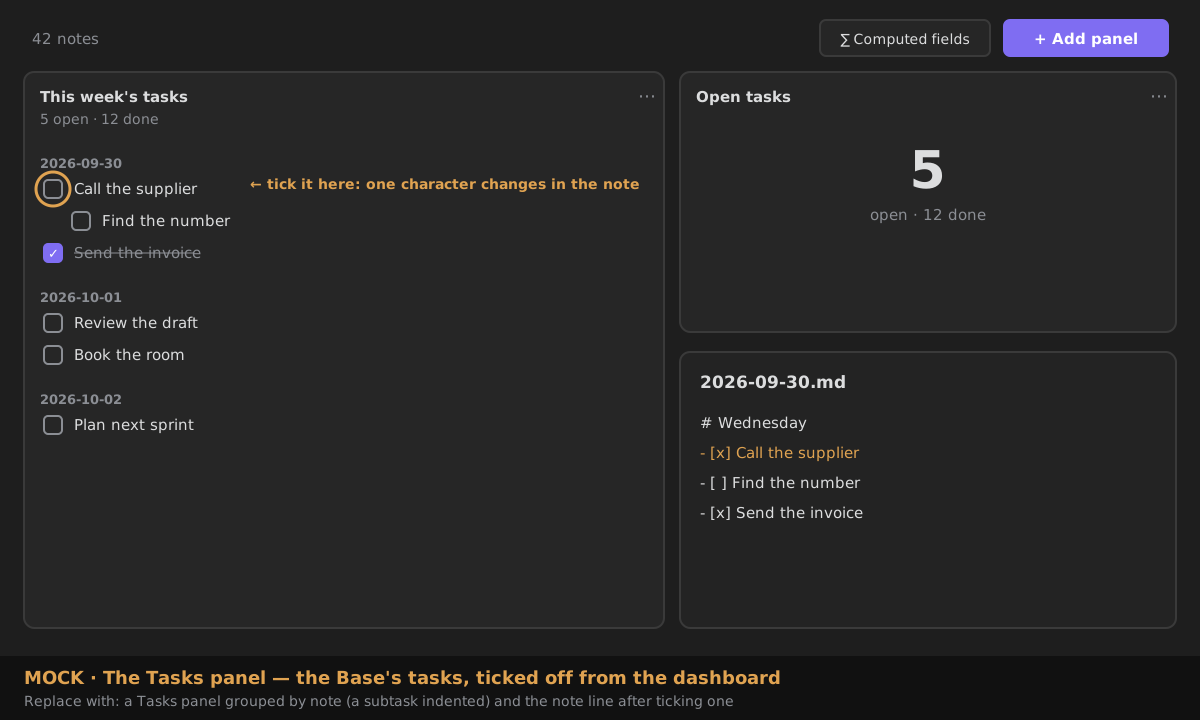
- Tick a task off where you see it. The checkbox changes that one character in the note (
[ ]→[x]), and nothing else. It is the only thing a dashboard ever writes, it happens only when you click, and it goes through ZettelFlow's single write path, which records it (without the task's text). If the line changed since the dashboard read it — you edited the task, or it moved — nothing is written and the panel says so, then shows the note as it is now. - The checkbox is its own undo: click it again and the line is exactly as it was.
- Click a task's text to open its note at that line (Mod-click: a new tab); hover for a page preview. Click a note's name to open the note.
- Edit a task in its note and the panel follows.
- Fast on a large Base. Only notes with tasks are read, several at a time, and a note that has not changed since the last update is not read again: the next update after an edit reads just that note (budget
dashboard.tasks.read.300).
The text is shown as plain text, as written — including any Tasks-plugin emoji. Due dates, priorities and custom statuses ([/], [-], shown as done) are left for later.
Transform the data
Each panel can reshape its data with a small pipeline of transforms, applied in order before the chart is drawn: filter, sort, group by, aggregate, bin, calculate, normalize, moving average and cumulative. A calculated, binned or averaged field is virtual — it exists only for the render and is never written back to your notes.
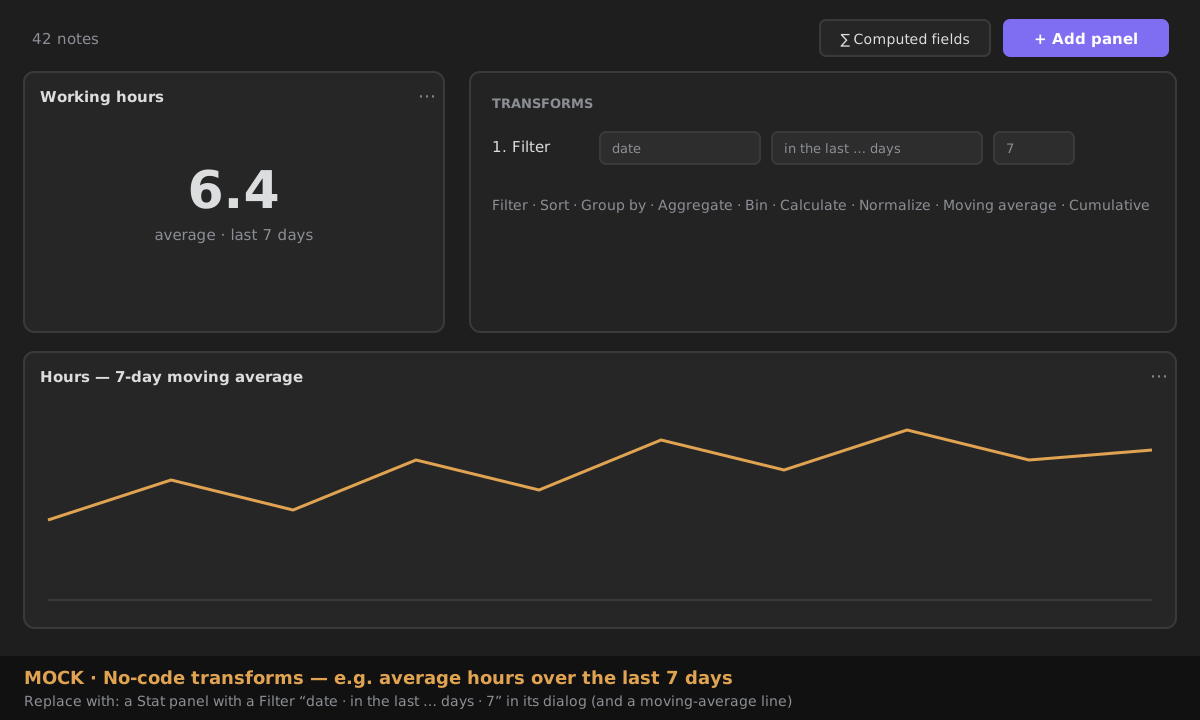
Filter compares numbers and dates as you'd read them (date ≥ 2026-09-01), and has a relative window for dates — in the last … days — so a panel can stay on this week without anyone editing a date. Average hours worked in the last week is a Stat (value realWorkingHours, aggregate average) with one step: Filter · date · in the last … days · 7. Today counts as one of the seven; a date in the future never matches.
Three levels, lowest first — reach for the lowest that answers your question:
- Base formulas — the native, preferred way to derive a value.
- Visual transforms — the no-code pipeline above.
- Computed fields — a dashboard-level script in the JS editor that runs once per note, given its
row+ a read-onlyzf(below).
Computed fields (advanced)
For the rare value the visual transforms cannot express, define a computed field: a small JavaScript body, authored once at the dashboard level (the Computed fields button) in the plugin's own editor. Every field it returns becomes a first-class field that appears in every panel's picker. It is off by default and says so when enabled, because it runs code you provide.
How it works
The body runs once per note and returns an object of the new fields for that note:
rowis that note's fields, by short name (row.realWorkingHours) and by full id (row["note.realWorkingHours"]). Note properties win a short-name clash; formulas arerow["formula.x"]when a property has the same name.indexandrowsare there for a field that needs its neighbours (a day-over-day change:rows[index - 1]).zfis the read-only, offline script API (below).
Missing values are handled for you
Most fields are not in every note. A field a note does not have is undefined in its row — never a fake 0 or "" — and arithmetic on it yields NaN, which ZettelFlow stores as empty. So row.realWorkingHours / 8 is simply empty for a day you did not log hours; no guard needed.
- Want a default instead?
row.realWorkingHours ?? 0. - Return nothing (
return;) for a note to leave its new fields empty. - A note whose code throws (say,
row.tags.lengthon a note without tags) is skipped: its new fields are empty, every other note still computes, and the dashboard says how many notes were skipped and why. The script only fails as a whole if it fails for every note. - A returned name that is already a field of the Base is ignored (with a warning) — a computed field adds, it never overwrites your data.
Types
A new field's type is inferred from its values (empty cells don't count), but you can declare it when inference would get it wrong — return { value, type } for that field (date, number, category, boolean, link), so a string-shaped date charts on a time axis:
The editor
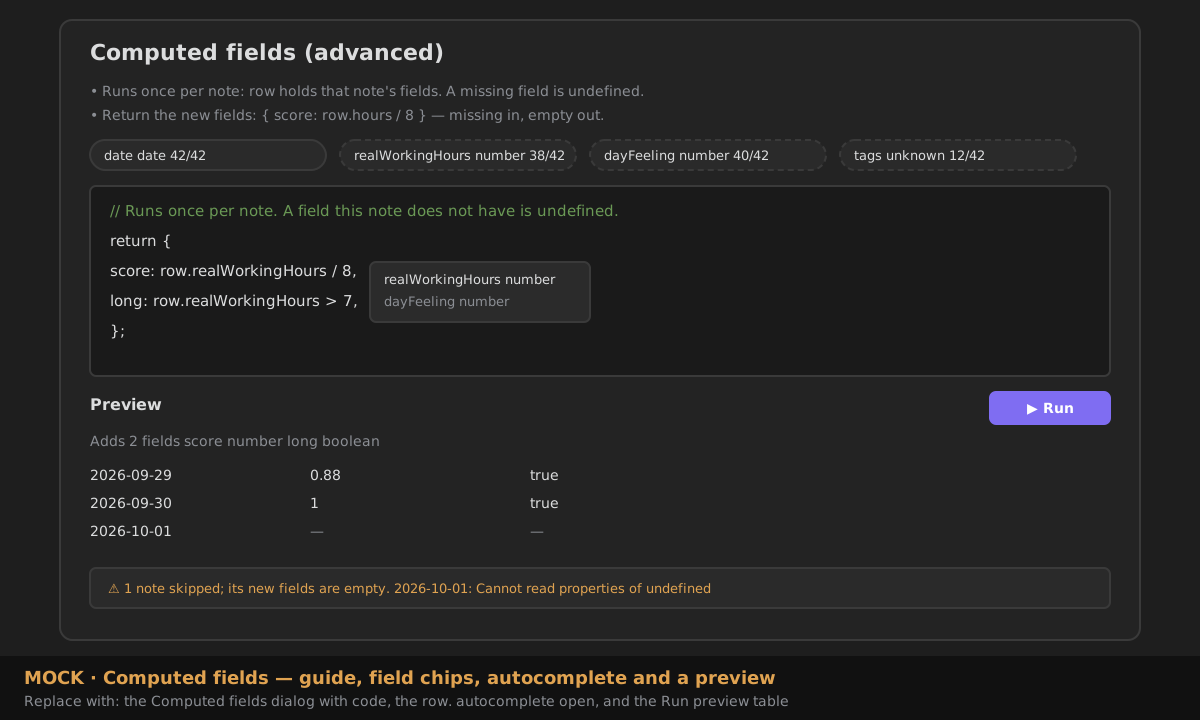
Everything you need is on one screen:
- the three rules above, in three lines, with a link here;
- this Base's fields as chips — name, type and how many notes carry it (a dashed chip is a field some notes lack) — click one to insert
row.<name>at the caret; row.autocompletes those fields, andzf.completes the API, with hover docs;- Run previews the code over the real notes — in memory, nothing saved or written — and shows the new columns, their inferred types, the first rows, and any note it skipped, with the reason.
The sandbox
The sandbox is deliberately small and offline: the script gets the rows and a read-only zf — zf.knowledge plus vault reads. It gets no app, makes no vault write and reaches no network (so it never auto-calls AI — a computed field resolves automatically, and AI never auto-fires in an automation). Its output enriches the shared snapshot in memory only, never a note. Resolution runs off the render path and is cached per data signature; a script that fails for every note fails safe — the panels keep the un-enriched data and an inline message names the error (click it to open the editor).
Capability — script execution, no network. Enabling this runs user-provided JavaScript, opt-in, through ZettelFlow's single function-constructor home (the same one the Script action and vault hooks use); every run — including each preview — is recorded in the script run log.
A script written for the earlier rows => rows contract (return rows.map(...)) still works: an array returned for the first note is taken as the whole result.
Worked example — daily tracking
This rebuilds a journaling dashboard — the kind people wire up with dataviewjs today — as pure configuration. Start from daily-tracking.base, point the folder filter at your own journal, open the Dashboard view, and add four panels:
- Stat — Working hours: value
realWorkingHours, aggregate average. - Stat — Mood: value
dayFeeling, aggregate average. - Bubble — Productivity: x a date field, y
realWorkingHours, sizeproductivitySize, colourrealWorkingHours. - Bar — Focus & mood: category the date, series
focusLevelanddayFeeling.
Change the Base's filter from the last 45 days to the last 90 and every panel follows — no dataviewjs to rewrite.
filters:
  and:
    - 'file.inFolder("Journal")'
    - 'file.name != "readme"'
formulas:
  productivitySize: 'if(goalsAchieved, 3, 1) + file.tasks.completed.length'
views:
  - type: zettelflow-dashboard
    name: Daily dashboard
How it reads the Base
- The Base owns the query: filters, formulas, properties, sort and grouping are configured in the Base itself — ZettelFlow never builds a parallel query engine.
- ZettelFlow reads the already-filtered result and normalises it once into a shared, in-memory model every panel reads; it updates in place on each change and stays fast on vaults of thousands of notes. Read-only throughout.