The script workbench
Four of the five places ZettelFlow runs code had no way to be tried at all, and the fifth — the Script action's debug run — ran against an empty note: no title, no content, nothing to read. The only rehearsal the product offered taught the wrong thing.
The workbench is a view of its own (command: Open the script workbench, and a try it button beside a script). You pick:
- what kind of script it is — a step action, a dynamic selector, a property hook or a condition. The editor then offers exactly what that surface hands your script, from the same constants the real run injects;
- the note to run it against — a real one, so
note, the frontmatter and the path are the real thing. It is optional: a script that is handed no note is told so plainly (no title, and empty frontmatter), and a surface that is handed one asks for it rather than running against a blank and calling that a test.
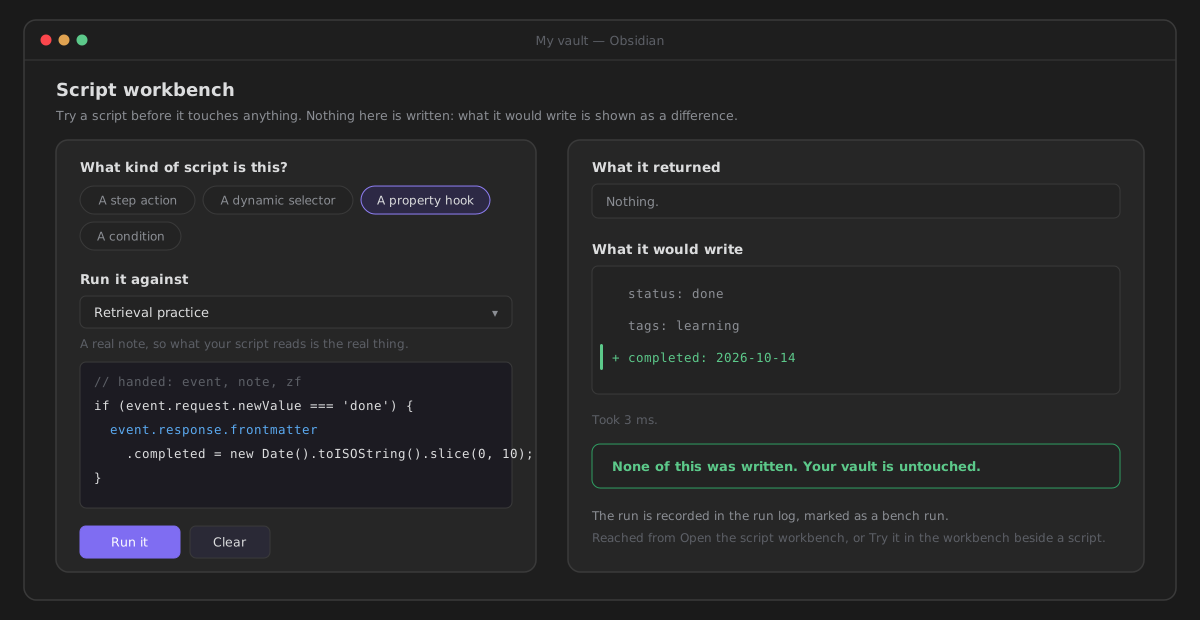
Running shows what it returned, what it would have written as a difference, and how long it took. The run is recorded in the log like any other, marked as a bench run.
Nothing is written
Your script is handed DTOs seeded from the note you chose; what it leaves in them is shown, not saved. The module reaches no writer at all, and a guardrail test asserts it — the same guarantee, made the same way, as the flow rehearsal.
A script that writes directly (calling app.vault.modify itself, rather than through the content/note it was handed) is beyond what the bench can hold back. That is true of the real run too, and it is worth knowing before you press run it.
Console output still goes to the developer console: capturing it would mean patching a global, and a bench that quietly changes the environment is worse than one that tells you where to look.
The run log
Under the bench is everything your scripts have been doing — every run, wherever it came from, newest first. One line each: when, which surface, which script, the note it ran on, and either how long it took or what it threw.
Two filters (a surface, and only the failures) and two actions per entry:
- Run it here puts the bench back where that run was: its surface, its note, and — when the script can still be found, as a property hook's can — its code. A note that has since been deleted says so rather than opening a blank run.
- Open the file, for a library module that failed to load.
At the bottom: how long runs are kept (7 days by default, up to 30), and a way to clear the log that tells you how many records it dropped. The retention control lives here, where the log is read, rather than as one more row in the settings panel — #439 exists so that panel stops growing.
There are deliberately no badges, no counts in the ribbon and no leaderboard of failing scripts. You go and look.
The editor around it (#449)
Wherever you write a script — the bench, a step's Script action, a .js module — the editor offers the same three things:
- completions and hover built from that surface's binding contract, plus your own documented library functions (#448);
- the bindings palette: what this surface hands your script, insertable at the cursor instead of remembered. It reads the same constants the runtime injects from, so it cannot drift;
- a starting point: the surface's examples, one click into an empty editor.
A .js library module has one action of its own: hand it to the workbench, where it can be called against a real note.
Two things deliberately not built
- Formatting. It would mean bundling a formatter for a nicety, and the plugin's weight is a user's load time.
- Go to definition. That is language-server shaped, which the epic put out of scope — and the library manager already opens any module in one click.
The // TODO: linter button action that sat in the code view is gone: the gutter already lints as you type, so the button would have duplicated it. A dead affordance is worse than no affordance.
README vocabulary for this page: Script workbench.